Real Estate Market Statistics Around Winnipeg and Surrounding Areas for July 2026
Winnipeg Real Estate Market Update for July 2026
The Winnipeg real estate market in July 2026 continued to show a clear divide between sales activity and home prices. Buyers had more listings to choose from than last summer, while fewer properties changed hands. Despite slower sales, prices remained resilient across most property types.
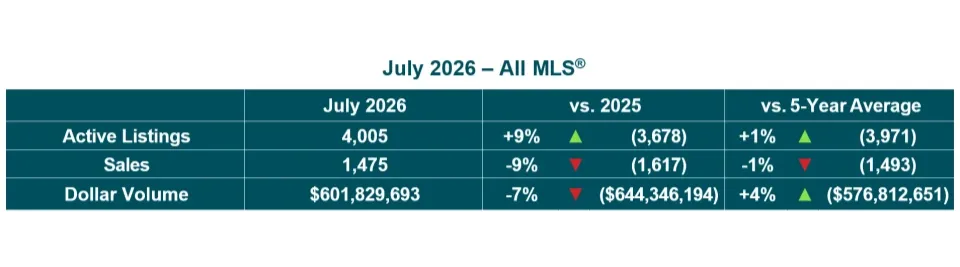
Across all MLS® property types, 4,005 active listings were available in July, up 9% from July 2025 and 1% above the five-year average. Meanwhile, 1,475 MLS® sales represented a 9% year-over-year decline and were 1% below the five-year average.
Dollar volume declined 7% from last July to approximately $601.8 million, although it remained 4% above the five-year average.
The overall picture is one of more choice and slower activity, but relatively stable property values.
Residential Detached Homes
Residential detached homes remained the largest and most active segment of the Winnipeg housing market in July.
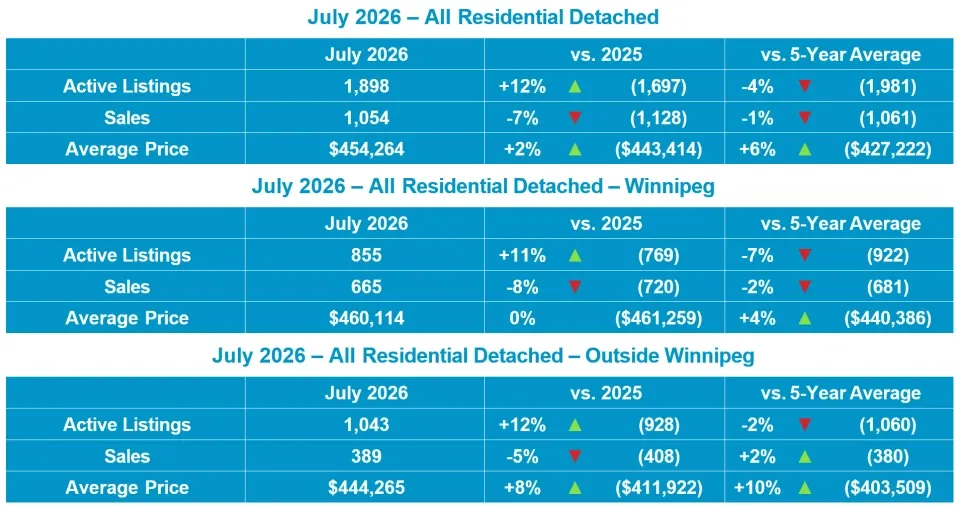
There were 1,054 detached sales, down 7% from July 2025 and just 1% below the five-year average. Active listings climbed 12% year over year to 1,898.
Despite more inventory and fewer sales, the average residential detached price reached $454,264, up 2% from last July and 6% above the five-year average.
This combination suggests the detached market is becoming more balanced. Buyers have more options than they did last summer, but increased inventory has not translated into broad price declines.
There were also some differences between Winnipeg and surrounding communities,
- Winnipeg: 665 sales, down 8%, with an average price of $460,114.
- Outside Winnipeg: 389 sales, down 5%, while the average price climbed 8% to $444,265.
- Active listings increased 12% both inside and outside Winnipeg.
The stronger price growth outside Winnipeg is notable, particularly since sales were lower than last year.
Where Were Detached Buyers Most Active?
Waverley West recorded the most residential detached sales in Winnipeg during July, followed by West Kildonan. Outside Winnipeg, the Steinbach area led sales followed by Morden/Winkler.
The middle of the market continued to attract the most buyers:
- $400,000–$499,999: 257 sales, representing 24% of all detached sales
- $300,000–$399,999: 228 sales, representing 22%
Together, these two price ranges accounted for 46% of all residential detached sales in July, showing where much of the market's activity is concentrated.
At the higher end, 21 detached homes sold for $1 million or more compared with 20 last July. Luxury sales therefore remained relatively steady even as overall sales declined.
Putting July Sales in Perspective
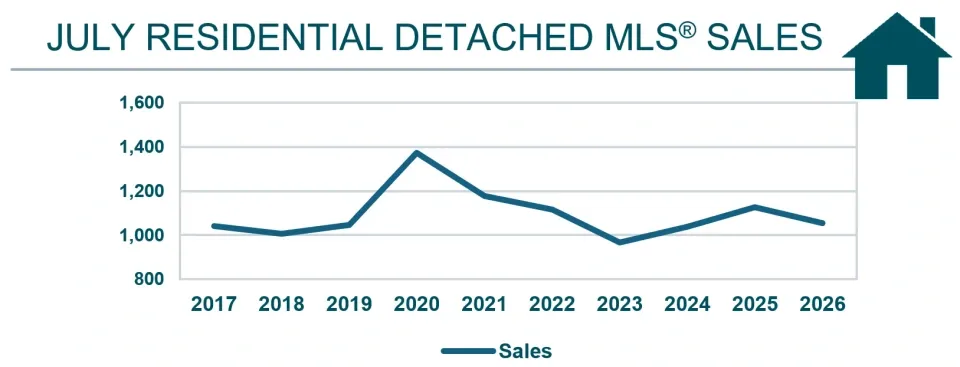
July's sales decline looks less dramatic when viewed over a longer period. Sales are well below the unusually high level reached in 2020, but July 2026 remains relatively close to several other recent years.
That fits with sales being only 1% below the five-year average. The market has slowed compared with 2025, but July's activity is not far outside recent historical norms.
Residential Detached Market So Far in 2026
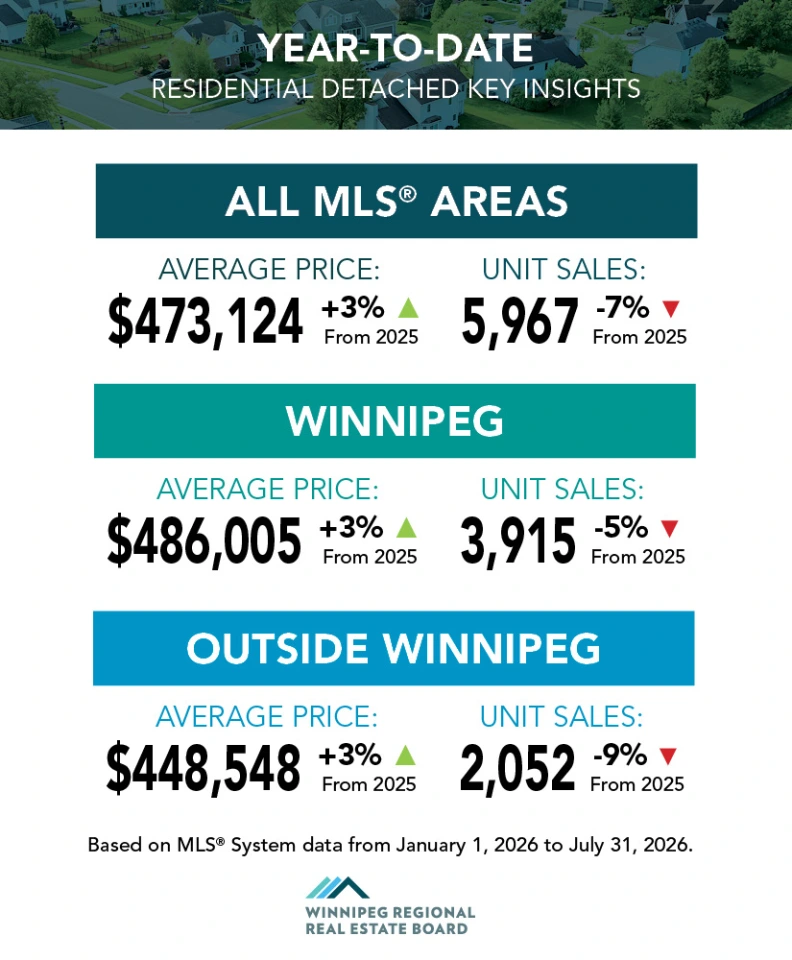
Year-to-date statistics reinforce one of the biggest trends in the Winnipeg real estate market in 2026: prices are rising even as fewer homes sell.
Across all MLS® areas, the average residential detached price reached $473,124, up 3%, while unit sales fell 7%.
Winnipeg followed a similar pattern, with its average price rising 3% to $486,005 while sales declined 5%. Outside Winnipeg, prices were also up 3% while sales declined 9%.
In other words, softer sales activity has not automatically translated into lower home values.
Home Prices Around Winnipeg
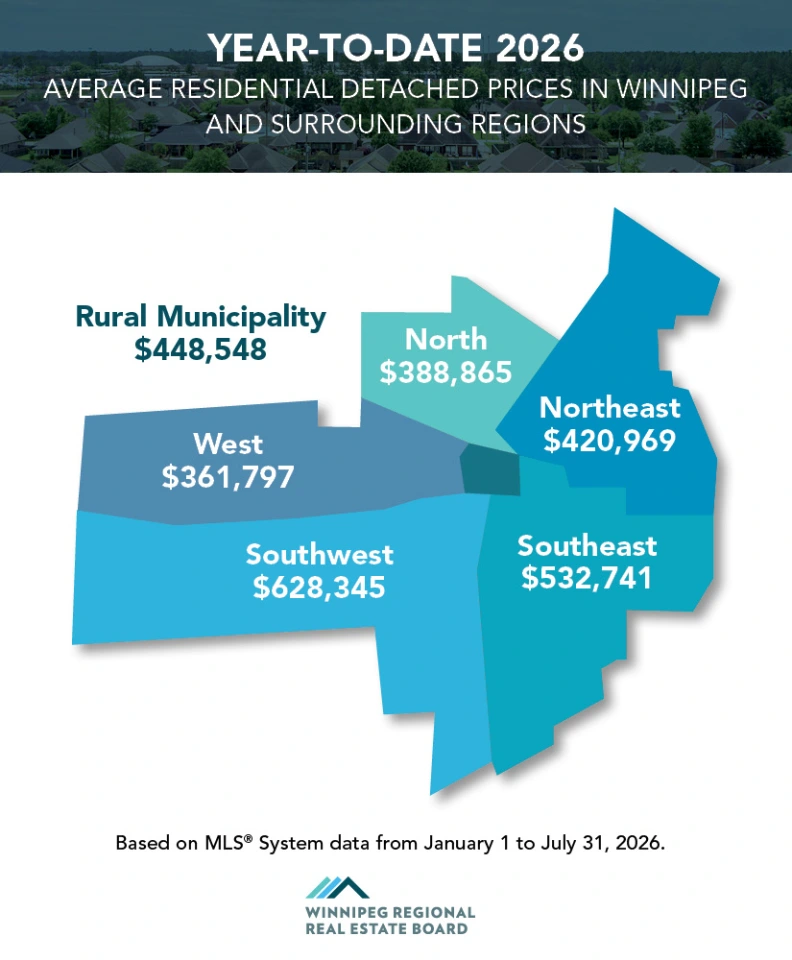
Location continues to make a significant difference in what buyers can expect to pay.
Year-to-date residential detached average prices range from $361,797 in the West to $628,345 in the Southwest. The Southeast was also well above the regional average at $532,741.
These differences are a good reminder that a single Winnipeg-wide average doesn't tell the whole story. Local neighbourhood and regional conditions can look very different.
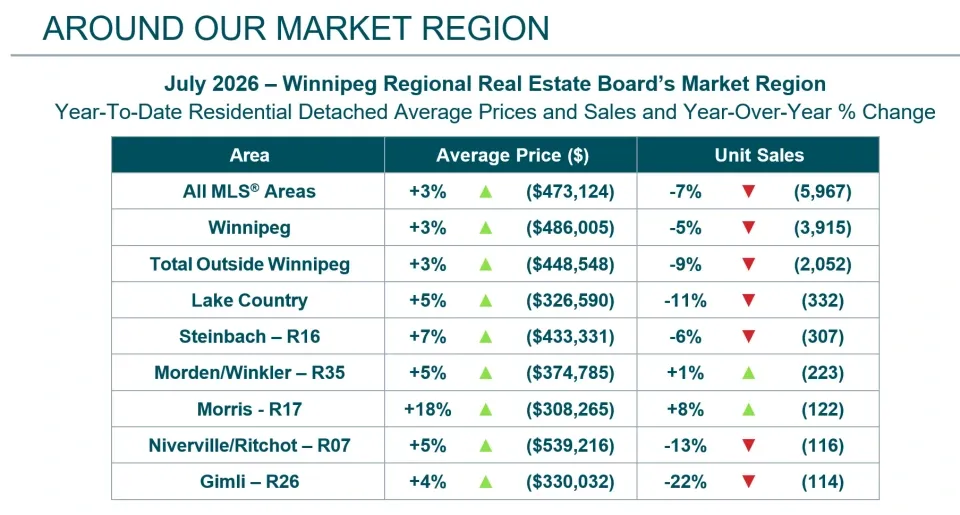
The regional numbers also reveal a few markets moving against the overall sales trend. While residential detached sales were down 7% across all MLS® areas, Morris–R17 sales increased 8% and Morden/Winkler–R35 edged 1% higher.
Morris–R17 also recorded an 18% increase in average price, the largest increase among the regions shown.
Residential Attached Homes
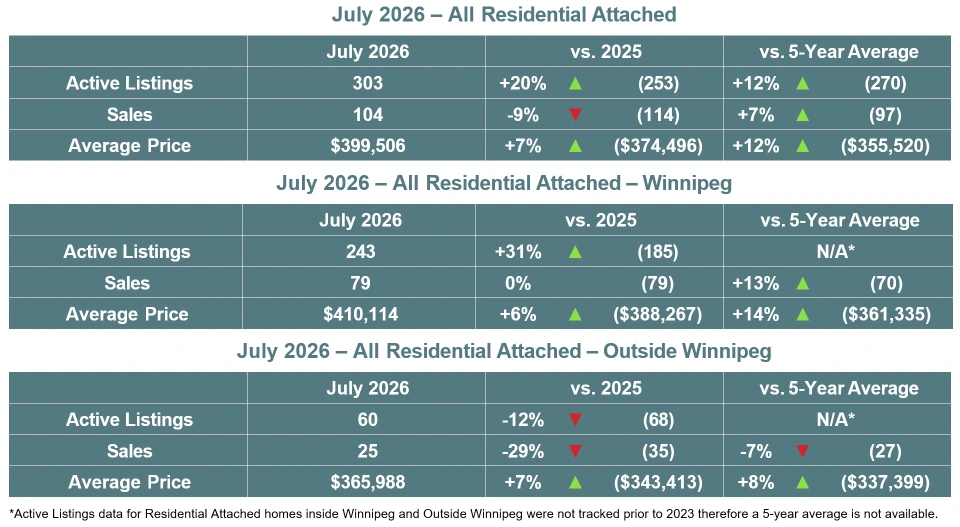
The residential attached market also saw more inventory and higher prices in July.
There were 104 sales, down 9% from last year. However, sales remained 7% above the five-year average. Active listings increased 20% to 303 while the average price climbed 7% to $399,506.
Winnipeg's attached market is particularly interesting,
- Active listings increased 31%
- Sales were unchanged from July 2025 at 79
- The average price increased 6% to $410,114
That means inventory expanded significantly without a corresponding decline in sales, giving Winnipeg buyers considerably more selection.
Outside Winnipeg told a different story. Sales fell 29% and listings declined 12%, although the average price still increased 7% to $365,988.
The contrast shows why attached market conditions should be viewed separately inside and outside Winnipeg rather than treating the region as one market.
Winnipeg Condominium Market
The Winnipeg condominium market experienced a more noticeable slowdown in sales during July.
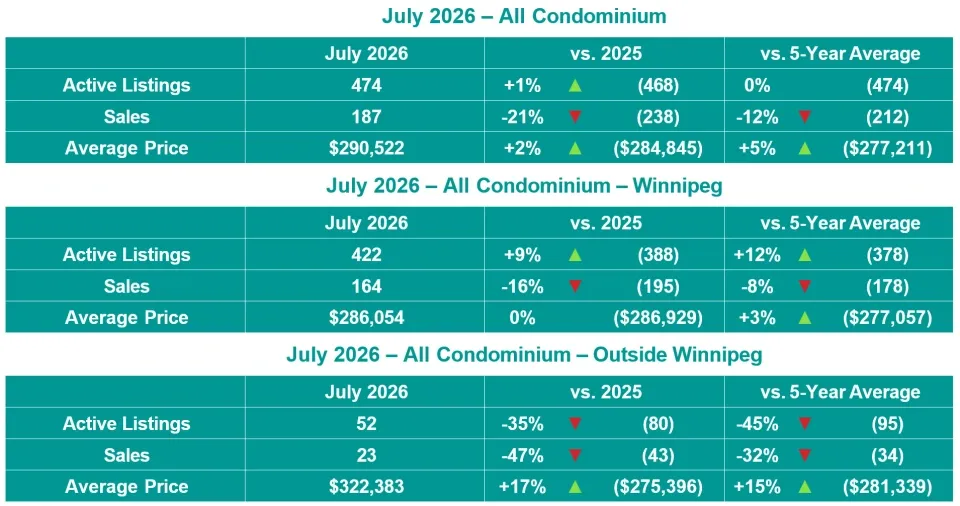
Across the region, 187 condominiums sold, down 21% from July 2025 and 12% below the five-year average. The average condo price nevertheless increased 2% to $290,522 and remained 5% above the five-year average.
Inside Winnipeg, condo sales declined 16% while active listings increased 9%. The average price was essentially unchanged at $286,054.
This combination — more listings, fewer sales and flat pricing — suggests Winnipeg condo buyers have more choice and potentially less urgency than they did last summer.
Outside Winnipeg, condo sales dropped 47% while the average price increased 17% to $322,383. However, only 23 sales occurred outside the city, so percentage swings can be much larger in this smaller market.
Where Were Condo Buyers Most Active?
Osborne Village recorded the most condominium sales in Winnipeg, followed by Fort Richmond and Richmond West.
Outside Winnipeg, Morden/Winkler recorded the most condo sales followed by Niverville/Ritchot and Steinbach.
Affordability also appears to be an important driver of condo activity:
- $200,000–$299,999: 59 sales, representing 32% of July condo sales
- $100,000–$199,999: 52 sales, representing 28%
Combined, condos priced between $100,000 and $299,999 represented 60% of July sales. That concentration shows how important the lower and middle price ranges remain to the condominium market.
Lake Country Real Estate Market
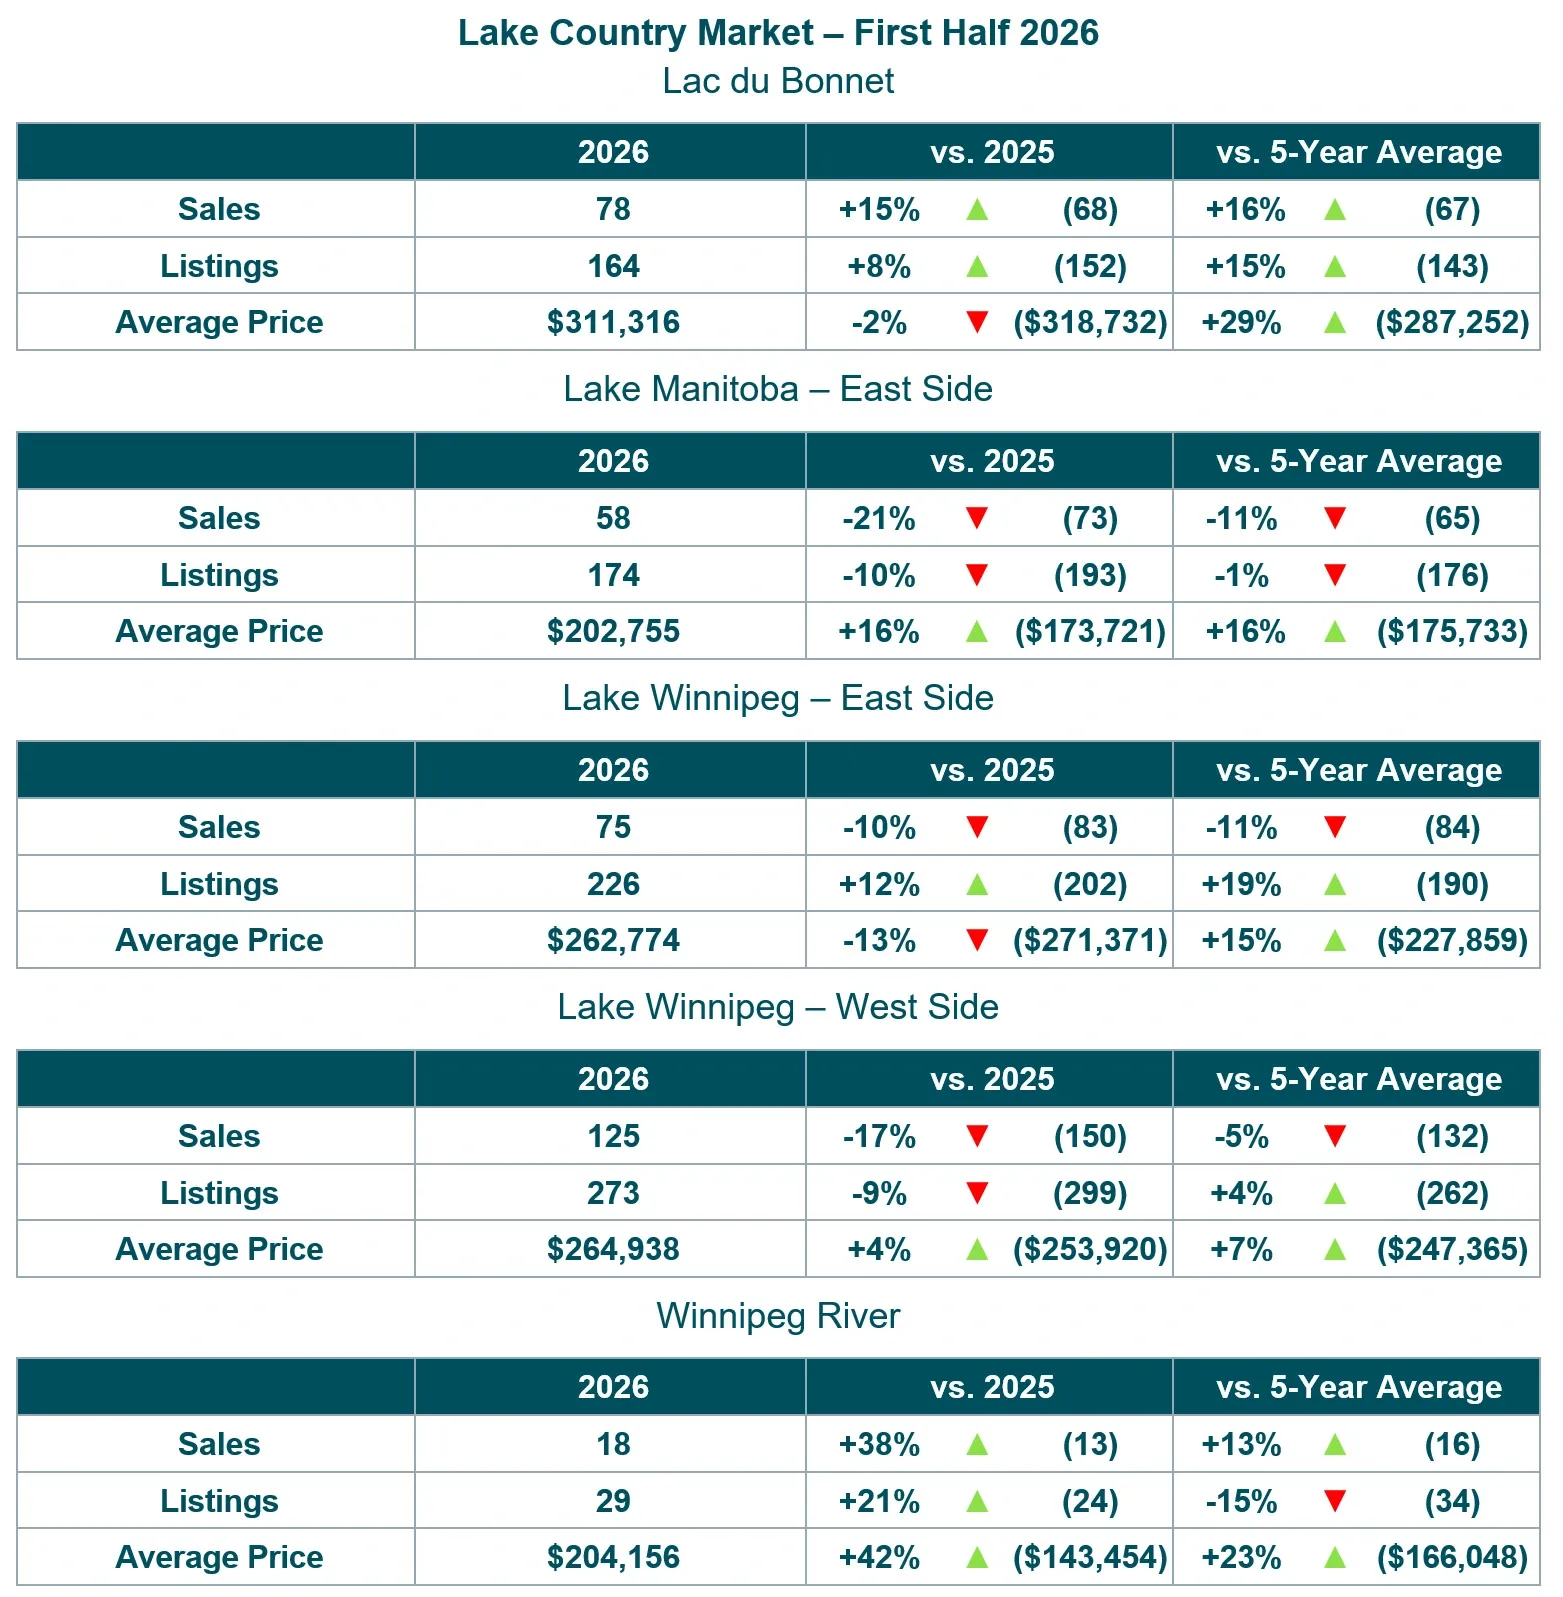
The Lake Country market shows just how much real estate conditions can vary from one community to another.
Lac du Bonnet had a strong first half, with sales up 15% and listings up 8%. Winnipeg River recorded an even larger 38% increase in sales, along with a 42% increase in average price.
Other areas saw the opposite trend. Lake Manitoba – East Side sales declined 21%, while Lake Winnipeg – West Side sales were down 17%.
Yet prices remained relatively strong in several of these areas. Lake Manitoba – East Side, for example, recorded a 16% increase in average price despite the decline in sales.
Once again, fewer transactions don't necessarily mean falling prices.
What Does the July 2026 Winnipeg Real Estate Market Mean?
July's statistics point toward a more balanced Winnipeg real estate market, but conditions vary considerably by property type and location.
For buyers: Rising inventory means more selection, particularly for residential detached homes, attached homes and Winnipeg condominiums. Slower sales may also provide buyers with more time to compare their options.
For sellers: More listings mean greater competition. Pricing a property appropriately for its specific neighbourhood and property type becomes increasingly important when buyers have more alternatives.
The biggest takeaway from July is that sales have slowed and inventory has grown, but prices remain resilient. Rather than one market moving in a single direction, Winnipeg and the surrounding region continue to show significant differences between property types, price ranges and communities.
Tara Zacharias, REALTOR®
Categories
Recent Posts





Leave a Reply
 REALTOR®
I became a REALTOR® because I truly enjoy helping people find the place that feels like home and because providing exceptional service during such an important moment in someone’s life is something I genuinely care about. Supporting sellers as they move on, move up, or move forward is just as meaningful, and being part of that transition is something I’m grateful to contribute to.
I make the buying or selling journey feel organized and approachable with clear communication and practical guidance. With an approach supported by market data, trends, and neighbourhood insights, you'll always understand what’s happening and how to make the most informed decisions.
Whether you’re buying your first home, selling a place filled with memories, or planning your next step, I’m here as someone who listens, shows up, and puts your goals at the centre of every decision. I'm focused on what serves you best and I make your best interests my TOP priority.
I'm Tara Zacharias, a real estate salesperson located in the vibrant city of Winnipeg. Thanks for stopping by and taking the time to get to know me!+1(204) 293-0933 tara@tarazacharias.com330 St Mary Ave, Winnipeg, MB R3C 3Z5, CAN
https://tarazacharias.com/