3 Types of Real Estate Markets - Conditions, and Trends That Shape Home Prices

by Tara Zacharias

The Different Types of Real Estate Markets

Real estate isn’t defined by a single “good” or “bad” moment. Instead, the market moves through cycles shaped by supply, demand, economic conditions, and buyer sentiment. Whether you're buying, selling, or simply staying informed, understanding these market types can help you make better decisions and anticipate what comes next.

The Three Primary Real Estate Markets 

1. Seller’s Market

A seller’s market occurs when demand exceeds supplythere are more buyers looking for homes than there are listings available. This imbalance gives sellers the advantage and can create competition among buyers.

Key Conditions & Factors

  • Low inventory: Fewer homes available leads to more interest in each property.

  • High demand: Strong job growth, population increases, or low interest rates can fuel buyer activity.

  • Rising prices: With multiple offers common, prices often trend upward.

  • Short days on market: Homes sell quickly, sometimes within days or even hours.

Typical Trends

  • Multiple offers

  • Bidding wars

  • Above-list-price sales

  • Buyers waiving conditions to compete


2. Buyer’s Market

A buyer’s market emerges when supply exceeds demand. There are more homes available than buyers actively shopping, giving buyers more negotiating power and more choice.

Key Conditions & Factors

  • High inventory: Plenty of listings means less urgency for buyers.

  • Cooling demand: Higher mortgage rates, slower economic activity, or seasonal dips can reduce buyer interest.

  • Stable or decreasing prices: Sellers adjust expectations to attract buyers.

  • Longer days on market: Listings stay available for weeks or months.

Typical Trends

  • Price reductions

  • Negotiation on closing dates and conditions

  • Seller incentives (repairs, upgrades, credits)

  • More balanced offers without bidding pressure


3. Balanced Market

A balanced market sits between buyer’s and seller’s markets, with supply and demand in alignment. Neither side holds a strong advantage, making it the most stable environment for real estate activity.

Key Conditions & Factors

  • Moderate inventory: Enough listings for choice but not oversupply.

  • Steady demand: Buyer activity is consistent but not competitive.

  • Stable pricing: Prices typically remain even or show gradual, sustainable growth.

  • Predictable timelines: Homes sell at a normal pace without intense pressure.

Typical Trends

  • Fewer bidding wars

  • Reasonable negotiation room

  • Well-priced homes still move steadily

  • More transparency and predictability in the process


What Shapes These Markets?

Real estate markets shift over time based on a wide mix of conditions, factors, and broader trends. Here are the most influential,

Interest Rates & Borrowing Costs

Lower interest rates make mortgages more affordable, increasing buyer demand. Higher rates cool activity and can shift a seller’s market toward balance—or even toward a buyer’s market.

Inventory Levels

The number of homes available has a direct impact on pressure in the marketplace:

  • Low inventory → seller advantage

  • High inventory → buyer advantage

  • Moderate inventory → balance

Economic Conditions

Employment rates, wages, inflation, and consumer confidence all influence how comfortable people feel making major financial decisions like purchasing a home.

Population Growth & Migration

More people entering a region naturally increases housing demand. Out-migration, on the other hand, slows demand and increases supply.

Construction & New Housing Supply

When new builds enter the market, supply grows. When construction slows—often due to costs or labor shortages—existing homes absorb more of the demand.

Local Market Sentiment

Buyer and seller psychology plays a big role,

  • Fear of missing out increases demand

  • Uncertainty about rates or the economy slows activity

Shifts in confidence can turn a buzzing market into a quieter one almost instantly.

Seasonal Cycles

Real estate naturally ebbs and flows,

  • Spring: High activity

  • Summer: Steady

  • Fall: Balanced

  • Winter: Slower pace

While these aren’t the only drivers, they often amplify or soften the broader trends already in motion.

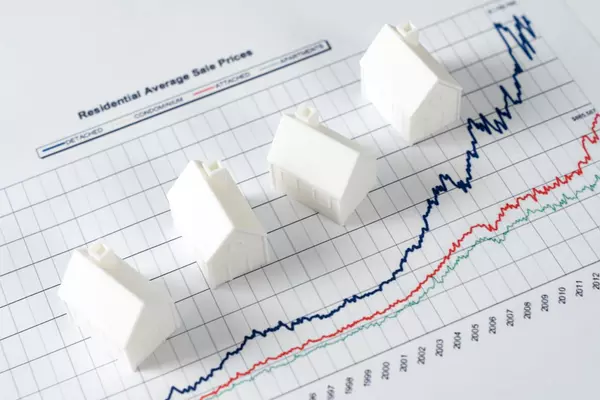
Gradual Home Appreciation

Gradual appreciation refers to steady, sustainable increases in property values over time — not sharp spikes caused by bidding wars or sudden demand surges.

It’s a sign of a healthy, stable market where prices rise in line with economic fundamentals like income growth, population trends, and long-term demand.

Why Gradual Appreciation Matters

  • It Indicates Market Stability - When home prices rise slowly over years rather than months, it signals that the market is not overheated. Buyers and sellers can make decisions without the pressure of rapid price jumps.
  • It Helps Build Long-Term Equity - Owners benefit from consistent value growth, which strengthens financial security without creating affordability crises.
  • It Often Aligns With Balanced Market Conditions - Balanced markets tend to produce moderate appreciation. Supply and demand are in harmony, preventing extreme highs and lows.
  • It Reflects Real Demand - Slow, steady price growth usually means,  
    • Reliable job markets
    • Stable population growth
    • Healthy lending conditions
    • Predictable buyer behavior

What Shapes Gradual Appreciation?

The same forces that influence market types affect price growth,

  • Interest Rates — Lower rates can boost demand, but appreciation stays steady if supply increases too.
  • Inventory Levels — Balanced supply prevents prices from jumping too quickly.
  • Economic Conditions — Slow, stable economic expansion supports sustained price growth.
  • Construction Trends — Adequate new housing helps moderate upward pressure on prices.
  • Population Patterns — Steady migration or population growth supports long-term value gains.

What This Means for Buyers and Sellers

  • Buyers benefit from predictability and reduced competition.

  • Sellers still see value growth but avoid unrealistic expectations.

  • Investors appreciate reliable long-term returns.

In markets like Winnipeg—where prices often rise steadily rather than explosively—gradual appreciation is one of the strongest indicators of long-term market health.


Why Market Stats Matter in Any Market

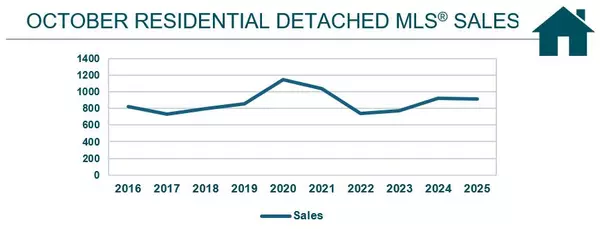
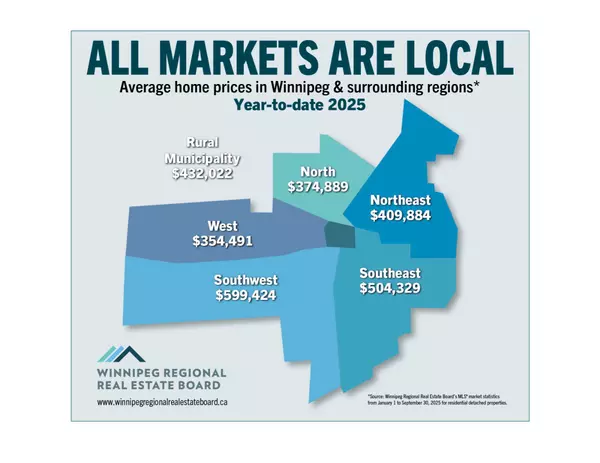
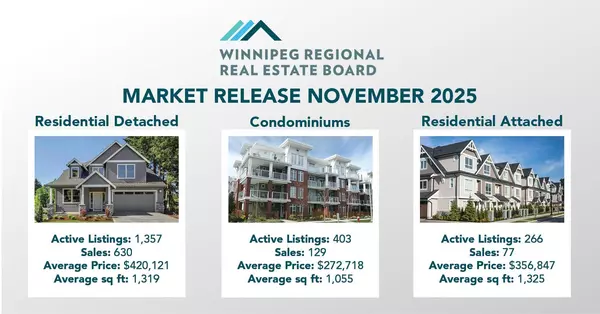
No matter the conditions—seller’s, buyer’s, or balanced—understanding key real estate statistics available from Winnipeg Regional Real Estate Board or your REALTOR® is essential. Metrics such as average home price, price per square foot, days on market, the sales-to-listing ratio, and year-over-year changes give buyers and sellers critical insight into how the market is behaving and what to expect.

Average Home Price

Average price gives a snapshot of what homes are selling for in the current environment. It helps buyers understand affordability and helps sellers determine realistic expectations. Rising or falling averages can also signal shifts in demand.

Price Per Square Foot

Price per square foot provides a more precise measure of value, especially when comparing homes of different sizes or styles.

  • Buyers can use it to determine whether a listing is priced fairly.

  • Sellers can use it to benchmark their home against recent sales.

This metric often reveals trends that average price alone can hide, especially in areas where home sizes vary widely.

Days on Market (DOM)

DOM indicates how quickly homes are selling:

  • Low DOM → Strong demand, fast-paced market

  • High DOM → Slower demand, more negotiation room

It helps buyers gauge competition and helps sellers understand how long selling might realistically take.

Sales-to-Listing (SLR) Ratio

The SLR ratio shows the balance between supply and demand. It is a key real estate metric that compares the number of homes sold in a given period to the number of new listings that came to market during the same time.

It is one of the most important indicators used to determine whether the market favors buyers, sellers, or is balanced.

How It’s Calculated

Sales-to-Listings Ratio = (Number of Sales ÷ Number of New Listings) × 100

Example:
If 600 homes sold and 1,000 homes were listed, the ratio is:
(600 ÷ 1,000) × 100 = 60%

  • Above 60%Seller’s market, there are more buyers than available homes.

  • 40–60%Balanced, supply and demand are relatively equal.

  • Below 40% Buyer’s market, there are more homes available than active buyers.

    This is one of the clearest indicators of who has the advantage in negotiations.

Year-Over-Year Gains or Declines

Year-over-year (YOY) data reveals longer-term trends,

  • Gains indicate rising values and strong demand.

  • Declines can signal cooling conditions or market correction.

This helps buyers understand appreciation potential and helps sellers time their listing for maximum return.

Putting It All Together

When combined, these statistics create a clear picture of the market’s temperature, momentum, and direction. They show how much homes are worth, how fast they’re selling, how competitive conditions are, and whether values are rising or falling over time.

Whether you're entering the market to buy, planning to sell, or simply monitoring local trends, understanding these core metrics empowers you to make smart, strategic decisions—no matter what type of market you’re in.

Not a Statistic but Relevent

Market Value

Market value reflects what a home is truly worth based on current conditions—not just what it’s listed for.  Market value is not a statistic, rather, it is a price determined by the homes condition/upgrades, location, property type/size/features and is influenced by buyer demand/willingness to pay, market forces, comparable sales from neighboring properties and economic stability. Understanding market value ensures buyers don’t overpay and sellers don’t underprice. 


Final Thoughts

Deciding whether to buy or sell in a seller’s, buyer’s, or balanced market is more than a timing decision — it’s a strategy. Each type of market brings its own opportunities, challenges, and leverage points, and understanding the conditions you’re stepping into can help you make choices that align with your goals.

While it’s almost always beneficial to enter the market as soon as you’re financially ready — so you can begin building equity and securing long-term stability — choosing how and when to buy or sell within the current market landscape can make a meaningful difference. The right market can offer you more negotiating power, stronger pricing outcomes, or a smoother path to your next home.

No matter the conditions, an informed approach gives you clarity, confidence, and the ability to maximize your position. With the right guidance and a clear understanding of market dynamics, you can make decisions that support both your financial future and your lifestyle needs.

Tara Zacharias, REALTOR®
 

Leave a Reply

Message

Name

Phone*