Real Estate Market Statistics Around Winnipeg and Surrounding Areas for September 2026
Real Estate Market Statistics Around Winnipeg and Surrounding Areas for August 2026
More Listings, Changing Sales Activity and Rising Home Values Across Winnipeg and Surrounding Areas
September 2026 brought an increase in housing inventory across Winnipeg and surrounding communities, giving buyers more properties to consider. While sales activity declined compared to September 2025, residential detached home prices continued to rise.
With the third quarter of 2026 complete, the year-to-date statistics provide a broader perspective on how the real estate market is performing.
More homes are available, fewer transactions are taking place and average detached home prices remain above historical levels.
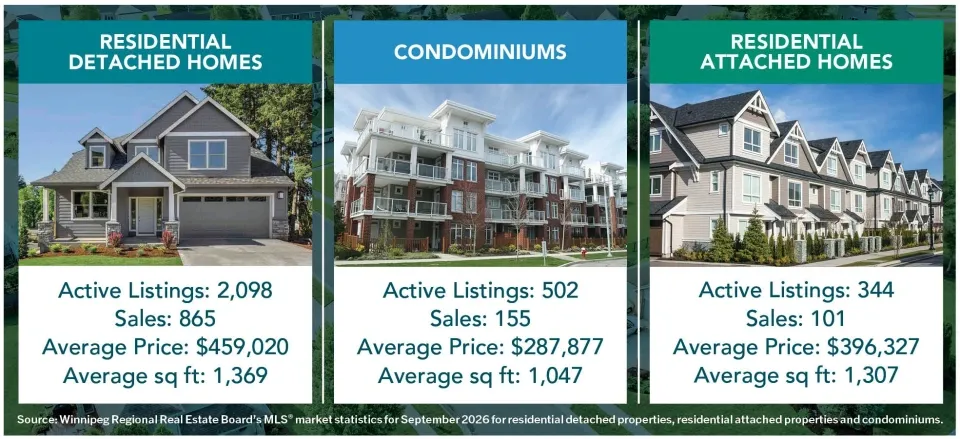
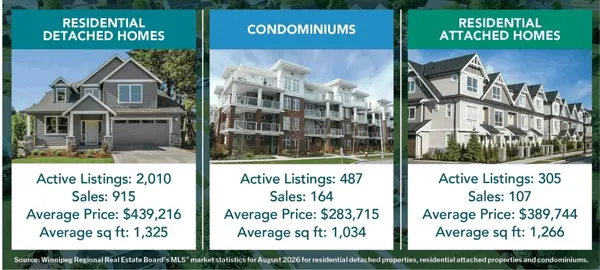
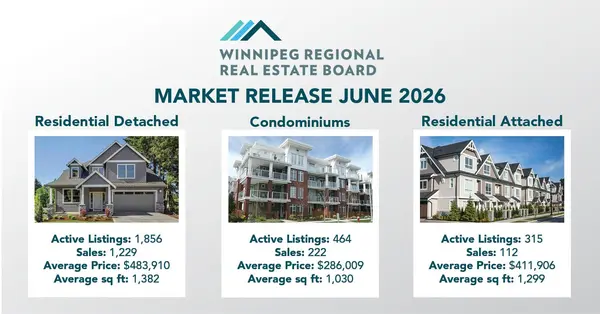
September 2026. Comparing Residential Property Types
Detached homes led September's market, accounting for approximately 77% of sales across the three residential categories.
-
Detached homes: Highest average price at $459,020, offering the most living space at 1,369 sq. ft.
-
Condominiums: Most affordable average price at $287,877, with 1,047 sq. ft.
-
Attached homes: An interesting middle ground at $396,327, offering nearly as much living space as detached homes for approximately $62,700 less.
Attached homes offer a compelling balance between price and space, while condominiums provide a lower purchase price.
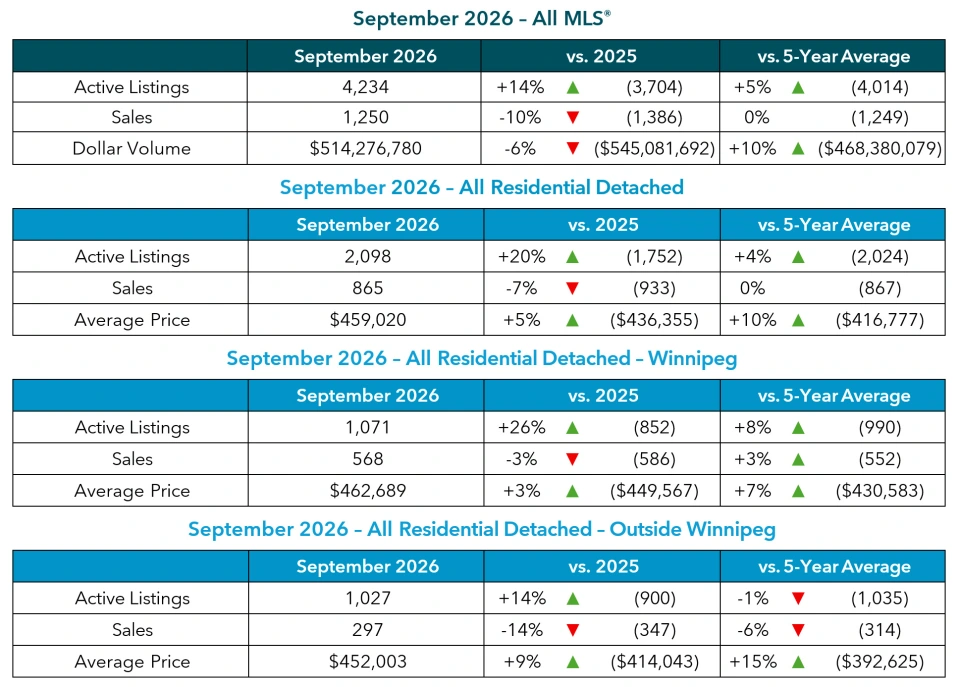
September 2026 Market at a Glance
Across all MLS® property categories, September recorded,
-
4,234 active listings, an increase of 14% from September 2025.
-
1,250 MLS® sales, a decrease of 10% year over year.
-
$514.3 million in dollar volume, down 6% from last September.
-
Active inventory 5% above the five-year average.
-
Sales activity virtually equal to the five-year average.
Although sales declined compared to last year, September's transaction volume was consistent with the five-year average. This distinction is important because a year-over-year decline does not necessarily indicate unusually low market activity.
Inventory increased by 530 listings compared to September 2025, providing buyers with more selection. However, pricing trends varied across property categories, highlighting the importance of evaluating each segment separately.
What Do These Numbers Tell Us?
-
Buyers have more choice. Increased inventory provides opportunities to compare properties, locations and pricing.
-
Sales have moderated. Buyers are purchasing fewer properties than last September, although overall sales remain consistent with historical averages.
-
Detached home prices continue to rise. Despite additional listings, average detached prices increased 5% year over year.
-
Market conditions vary by property type. Detached, condominium and attached properties are experiencing different levels of demand and price growth.
Understanding these differences is particularly important when determining a property's market value or developing a buying or selling strategy.
Residential Detached Homes. Prices Continue to Rise
September 2026 Residential Detached Statistics
-
Active listings: 2,098, up 20% from 2025.
-
Sales: 865, down 7%.
-
Average selling price: $459,020, up 5%.
-
Average home size: 1,369 sq. ft.
-
Average price compared to the five-year average: 10% higher.
What Stands Out?
The detached market experienced a substantial increase in inventory, with 346 more active listings than September 2025.
Despite this increase, the average selling price rose approximately $22,665 year over year.
This combination suggests that additional inventory has not resulted in a broad decline in average detached selling prices. Buyers have more properties to consider, but completed sales continue to support higher average values.
Another important observation is that September's 865 detached sales were almost identical to the five-year average of 867 transactions.
While sales declined 7% compared to last September, activity remained consistent with longer-term trends.
Winnipeg vs. Surrounding Areas
The areas outside Winnipeg recorded stronger average price growth than the city, increasing 9% compared to Winnipeg's 3%.
However, detached sales outside Winnipeg declined 14%, compared to a 3% decrease within the city.
This difference is worth considering. Higher average selling prices do not necessarily indicate that every home has increased in value by the same percentage. The type, size, location and condition of properties sold can significantly affect the reported average.
Where Are Buyers Most Active?
The greatest concentration of detached sales occurred in two price ranges
-
$300,000–$399,999: 199 sales, representing 23% of all detached transactions.
-
$400,000–$499,999: 171 sales, representing 20% of all detached transactions.
Together, these ranges accounted for approximately 43% of September's detached home sales.
At the higher end of the market, 25 detached homes sold for $1 million or more, compared to 15 during September 2025. The highest-priced sale exceeded $2.4 million.
Most Active Neighbourhoods
-
September: Waverley West recorded the most detached sales in Winnipeg, followed by Island Lakes.
-
Year-to-date: Waverley West led Winnipeg, followed by West Kildonan.
-
Outside Winnipeg: Steinbach led detached sales, followed by Morden/Winkler.
These figures reinforce the importance of understanding neighbourhood-level activity rather than relying exclusively on citywide statistics.
Condominium Market. More Selection and Slower Sales
The condominium market experienced a different September, with sales and average prices declining compared to the previous year.
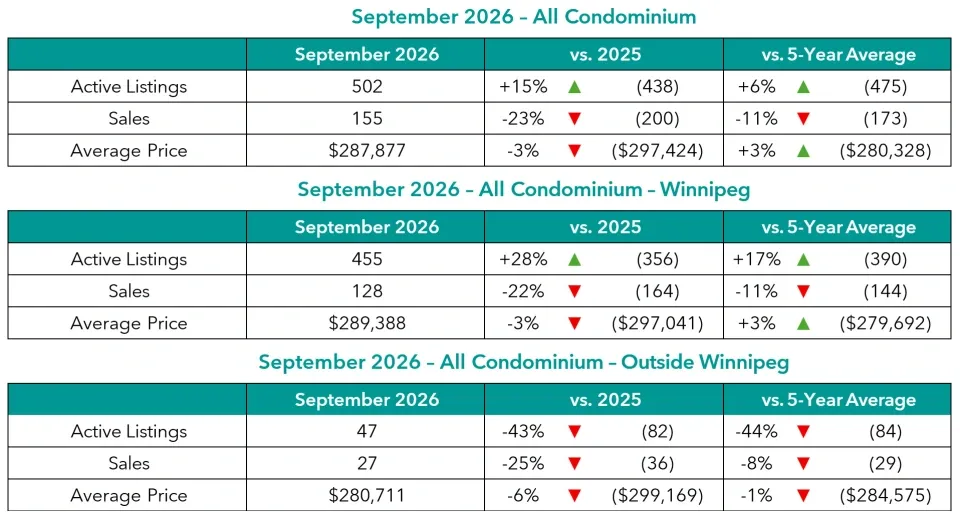
September 2026 Condominium Statistics
-
Active listings: 502, up 15% from 2025.
-
Sales: 155, down 23%.
-
Average selling price: $287,877, down 3%.
-
Average condominium size: 1,047 sq. ft.
-
Average price compared to the five-year average: 3% higher.
What Stands Out?
Condominium sales experienced the largest year-over-year decline among the three residential property categories.
September recorded 155 condominium sales compared to 200 in September 2025, a decrease of 23%.
At the same time, active inventory increased 15%.
Buyers have more condominium listings to compare while fewer properties are selling.
The average condominium price declined 3% year over year to $287,877. However, it remained 3% above the five-year average.
This suggests that while prices have moderated from last September, the average remains above its longer-term benchmark.
Winnipeg vs. Surrounding Areas
Winnipeg
-
Average selling price: $289,388, down 3%.
-
Active listings: 455, up 28%.
-
Sales: 128, down 22%.
Outside Winnipeg
-
Average selling price: $280,711, down 6%.
-
Active listings: 47, down 43%.
-
Sales: 27, down 25%.
Although the overall condominium market experienced increased supply, that increase was concentrated within the city.
Sales declined in both markets, demonstrating that inventory trends and buyer activity do not always move together.
Where Are Buyers Most Active?
Condominium sales were concentrated in lower price ranges compared to detached homes.
-
$200,000–$299,999: 49 sales, representing 32% of condominium transactions.
-
$100,000–$199,999: 47 sales, representing 30% of condominium transactions.
Together, these price ranges accounted for approximately 62% of all condominium sales during September.
Most Active Condominium Neighbourhoods
-
September: River Heights recorded the most condominium sales, followed by Osborne Village, Waverley West and Downtown.
-
Year-to-date: Osborne Village led condominium sales, followed by Downtown.
-
Outside Winnipeg: Morden/Winkler, Steinbach, Niverville/Ritchot and Gimli were tied for the most September condominium sales.
What Does This Mean for Condominium Owners?
With additional inventory available in Winnipeg, buyers have more opportunities to compare properties.
For sellers, pricing should consider more than square footage and location. Condominium fees, reserve fund information, building condition, amenities and recent comparable sales can all affect a property's market position.
For buyers, the additional selection may provide more opportunities to evaluate monthly ownership costs and property features before making a purchase.
Residential Attached Homes. Inventory Leads the Change
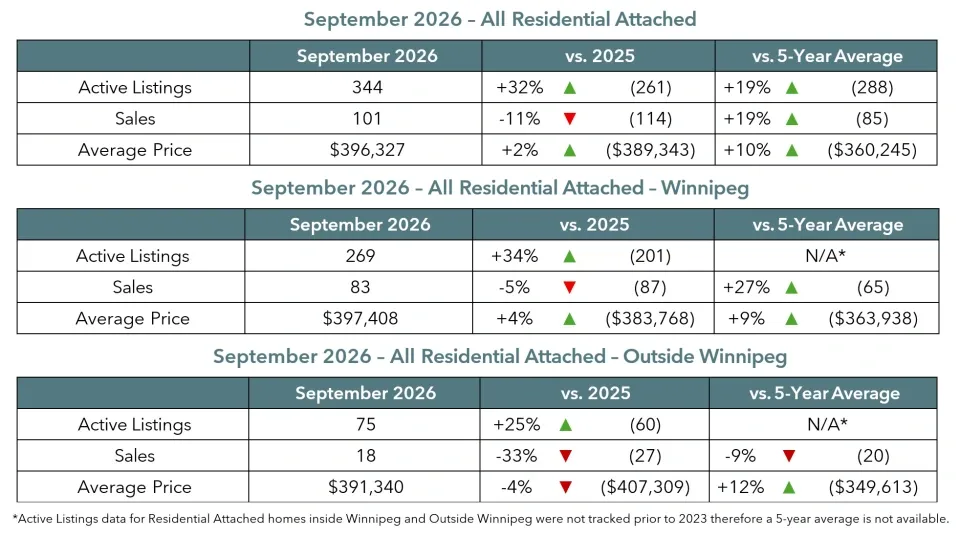
Residential attached properties, including qualifying townhouses and similar attached housing, experienced the largest percentage increase in active listings among the three residential categories.
September 2026 Residential Attached Statistics
-
Active listings: 344, up 32% from 2025.
-
Sales: 101, down 11%.
-
Average selling price: $396,327, up 2%.
-
Average home size: 1,307 sq. ft.
-
Average price compared to the five-year average: 10% higher.
What Stands Out?
Attached home inventory increased 32% compared to September 2025, the largest percentage increase of the three property categories.
Despite the increase in available properties, average prices rose 2% year over year.
Another notable difference is sales activity relative to historical levels.
Although attached home sales declined 11% compared to September 2025, they remained 19% above the five-year average.
This indicates that the decline from last year should be viewed in context. Attached homes continued to record sales activity above their historical September average.
Winnipeg vs. Surrounding Areas
Winnipeg
-
Average selling price: $397,408, up 4%.
-
Active listings: 269, up 34%.
-
Sales: 83, down 5%.
Outside Winnipeg
-
Average selling price: $391,340, down 4%.
-
Active listings: 75, up 25%.
-
Sales: 18, down 33%.
Within Winnipeg, attached home prices increased 4%, while sales declined only 5%.
Outside Winnipeg, sales declined 33% and the average selling price decreased 4%.
With only 18 attached home transactions outside Winnipeg during September, individual sales can have a greater effect on the reported average.
What Does This Mean for Buyers and Sellers?
Attached properties can offer an alternative for buyers comparing detached homes and condominiums.
The average September selling price of $396,327 placed attached homes between the detached and condominium categories.
For buyers, this may provide an opportunity to consider different property layouts, ownership structures and maintenance requirements.
For sellers, the substantial increase in active listings reinforces the importance of understanding how a property compares with similar homes currently available.
Year-to-Date 2026. A Broader View of the Market
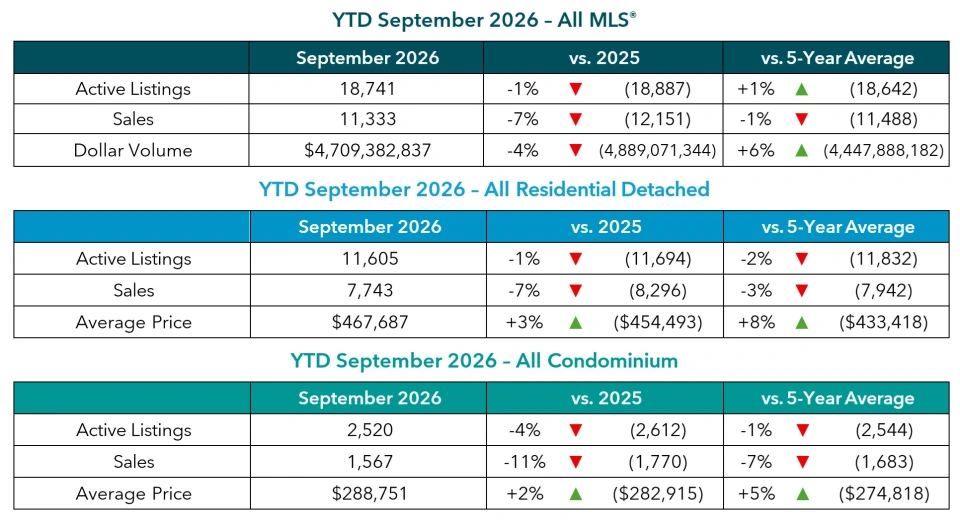
Through September 30, 2026, both residential detached homes and condominiums reached record year-to-date average selling prices across the Winnipeg Regional Real Estate Board's market area.
-
Residential detached homes: $467,687, an increase of 3% from 2025 and 8% above the five-year average.
-
Condominiums: $288,751, an increase of 2% from 2025 and 5% above the five-year average.
These results are particularly interesting when compared with September's condominium statistics.
Although the average condominium selling price declined during September, the year-to-date average remained higher than in 2025.
This demonstrates why a single month's results should not be interpreted as the direction of the entire market.
Year-to-Date Residential Detached Homes
All MLS® Areas
-
Average selling price: $467,687, up 3%.
-
Unit sales: 7,743, down 7%.
Winnipeg
-
Average selling price: $479,807, up 3%.
-
Unit sales: 5,047, down 5%.
Outside Winnipeg
-
Average selling price: $444,999, up 3%.
-
Unit sales: 2,696, down 9%.
What Do These Figures Reveal?
Three observations stand out,
-
Consistent price growth: Winnipeg and surrounding areas both recorded a 3% increase in average detached prices.
-
Fewer completed transactions: Year-to-date sales declined 7% across the market region.
-
A difference in market activity: Sales declined more sharply outside Winnipeg than within the city.
While fewer detached homes sold during the first nine months of 2026, the average selling price increased.
This reflects the importance of examining pricing and transaction volumes separately when evaluating market conditions.
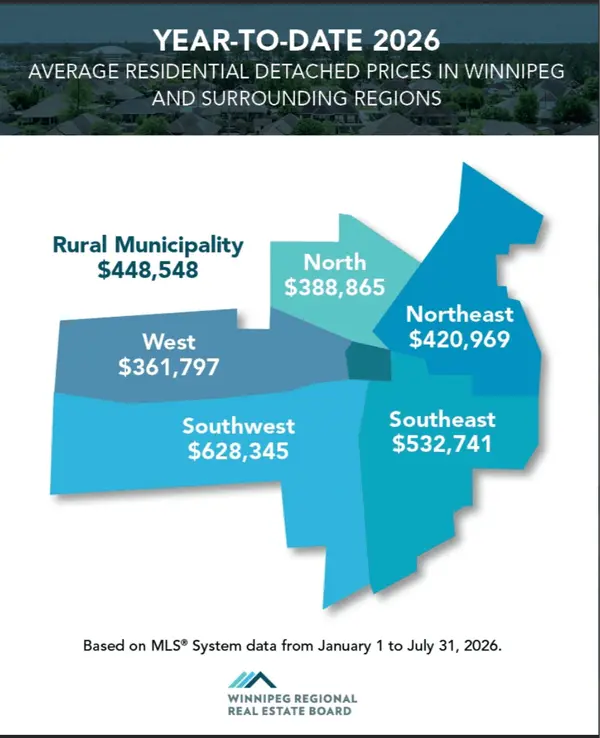
Winnipeg Neighbourhoods. How Do Average Prices Compare?
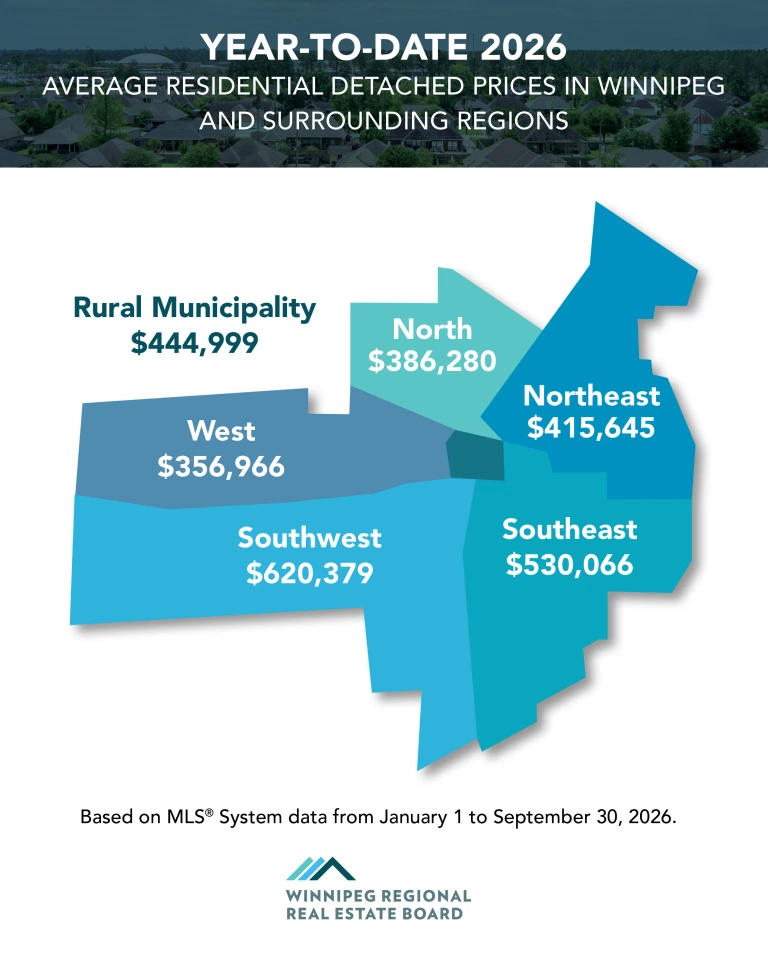
The year-to-date regional statistics demonstrate how significantly average detached home prices can vary depending on location.
What Do These Regional Differences Mean?
Southwest Winnipeg recorded the highest average detached selling price at $620,379, followed by Southeast Winnipeg at $530,066.
West Winnipeg recorded the lowest regional average at $356,966.
The difference between the highest and lowest regional averages exceeded $263,000.
This highlights why a citywide average selling price may not accurately reflect an individual property's value.
Neighbourhood characteristics, housing age, property size, renovations, lot dimensions and the types of homes sold can all contribute to differences between regional averages.
Even within the same region, individual neighbourhoods may experience different levels of demand and pricing.
For homeowners considering selling, a Comparative Market Analysis (CMA) based on relevant nearby properties provides more specific information than broad regional statistics.
Surrounding Winnipeg. A Look at Regional Communities
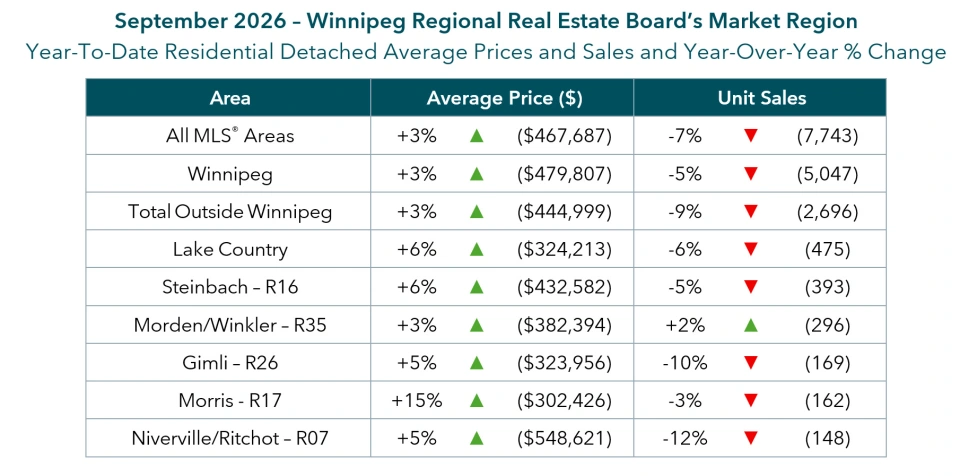
The year-to-date statistics show that average detached home prices increased across several surrounding areas, although sales activity varied.
Year-to-Date Detached Home Prices Outside Winnipeg
-
Niverville/Ritchot: $548,621, up 5%, with 148 sales.
-
Steinbach: $432,582, up 6%, with 393 sales.
-
Morden/Winkler: $382,394, up 3%, with 296 sales.
-
Lake Country: $324,213, up 6%, with 475 sales.
-
Gimli: $323,956, up 5%, with 169 sales.
-
Morris: $302,426, up 15%, with 162 sales.
What Stands Out Across the Region?
Niverville/Ritchot
At $548,621, Niverville/Ritchot recorded the highest average detached price among the surrounding areas highlighted in the report.
Despite a 12% decline in sales, the average selling price increased 5%.
Steinbach
Steinbach remained an active regional market, recording 393 detached transactions year-to-date.
Average prices increased 6%, while sales declined 5%.
Morden/Winkler
Morden/Winkler stood out as one of the few highlighted regions to record an increase in unit sales.
Transactions increased 2%, while average prices rose 3%.
Lake Country and Gimli
Both regions recorded average price increases despite lower sales volumes.
Lake Country experienced 6% average price growth, while Gimli recorded a 5% increase.
Morris
Morris recorded the largest percentage increase in average detached prices among the highlighted communities at 15%.
However, this should not be interpreted as a 15% increase in the value of every home. The mix of properties sold can significantly affect averages, particularly in smaller markets.
Why Regional Statistics Matter
Properties in rural municipalities may differ substantially in lot size, municipal services, outbuildings, construction and proximity to Winnipeg.
These differences can affect property values and buyer demand.
For anyone considering purchasing or selling outside Winnipeg, reviewing comparable properties within the relevant municipality or community is especially important.
What Does the September Market Mean for Buyers?
Key Considerations for Buyers
-
More selection: Increased active listings offer additional options across detached, condominium and attached housing.
-
Opportunity to compare: Buyers can evaluate pricing, property condition, locations and features across competing listings.
-
Different market conditions: Condominium sales declined more sharply than detached and attached sales, making it important to evaluate each category independently.
-
Neighbourhood-specific pricing: Average prices vary considerably across Winnipeg and surrounding communities.
-
Property-specific demand: Well-positioned homes can continue to attract interest even when overall inventory increases.
A market with more available listings does not necessarily mean every property will offer the same opportunity for negotiation.
Understanding comparable sales, listing history and current competition can help buyers make informed decisions.
What Does the September Market Mean for Sellers?
For sellers, the September statistics demonstrate that average prices can continue to rise even as inventory increases.
However, additional listings mean buyers have more properties to compare.
Key Considerations for Sellers
-
Accurate pricing: Recent comparable sales provide a foundation for determining market value.
-
Current competition: Active listings reveal what buyers are comparing against your property.
-
Property presentation: Condition, updates, photography and marketing can help distinguish a listing.
-
Neighbourhood activity: Local sales trends may differ from Winnipeg's overall statistics.
-
Market timing: Inventory and buyer activity can change throughout the year, affecting the competition a property faces.
A home's value is not determined by the citywide average price increase alone.
Understanding the property's specific market position is essential when establishing an asking price and developing a selling strategy.
Looking Ahead. Winnipeg Real Estate in the Final Quarter of 2026
As Winnipeg moves into the final quarter of 2026, three indicators will be particularly important to follow.
1. Inventory Levels
Will the increase in available properties continue, or will active listings decline as the year progresses?
Inventory trends can affect buyer selection and competition among sellers.
2. Sales Activity
Will transaction volumes return closer to last year's levels?
Detached sales have remained consistent with the five-year average, while condominium activity has fallen below its historical benchmark.
3. Average Selling Prices
Will detached home prices maintain their current levels as buyers consider a larger selection of available properties?
The relationship between supply, sales activity and pricing will provide further insight into how the market develops through the remainder of 2026.
Final Thoughts
Winnipeg's September 2026 real estate market reflects a combination of increasing housing supply, moderating sales activity and continued strength in average detached home prices.
While buyers have more properties to consider, sellers are still achieving higher average detached prices than a year ago.
The most important takeaway is that real estate market conditions are not identical across every property type, price range or neighbourhood.
Whether you're considering buying, selling or reviewing the current value of your property, understanding recent sales and current competition within your specific market provides a more accurate foundation for making informed decisions.
Tara Zacharias, REALTOR®
Categories
Recent Posts





Leave a Reply
 REALTOR®
I became a REALTOR® because I truly enjoy helping people find the place that feels like home and because providing exceptional service during such an important moment in someone’s life is something I genuinely care about. Supporting sellers as they move on, move up, or move forward is just as meaningful, and being part of that transition is something I’m grateful to contribute to.
I make the buying or selling journey feel organized and approachable with clear communication and practical guidance. With an approach supported by market data, trends, and neighbourhood insights, you'll always understand what’s happening and how to make the most informed decisions.
Whether you’re buying your first home, selling a place filled with memories, or planning your next step, I’m here as someone who listens, shows up, and puts your goals at the centre of every decision. I'm focused on what serves you best and I make your best interests my TOP priority.
I'm Tara Zacharias, a real estate salesperson located in the vibrant city of Winnipeg. Thanks for stopping by and taking the time to get to know me!+1(204) 293-0933 tara@tarazacharias.com330 St Mary Ave, Winnipeg, MB R3C 3Z5, CAN
https://tarazacharias.com/